30 Jan Maximize your omnibus survey results
You already know how practical and effective an omnibus survey is, but did you know you could maximize the research experience to get the best results?
The benefit of an omnibus is to turn research around quickly and efficiently – but like any research – without due diligence, the results may not be what you desire. Before you hire an omnibus service provider, you may want to explore ways to maximize your research results.
Our omnibus solution, OnTopic®, is useful and economical when you want to get a quick pulse-check on burning questions or pressing issues.
Like other omnibus services, OnTopic runs every month as a cost-shared survey, with members of our proprietary market research panel, SaskWatch Research®.

If you need answers or opinions from the general population of Saskatchewan (or from either Saskatoon or Regina), you can ask your questions to the omnibus for fast and cost-effective research solutions.
While our research panel is built with Saskatchewan residents, our norms ensure that our panel members are more than their location – they are farmers, business owners and millennials. Norms allow us to sample for projects with interest outside of Saskatchewan.
An omnibus is an agile solution that can turn around your research questions – from fielding them to providing detailed tables – in just a week. And since your questions are bundled with others on the survey, omnibus surveys can be a practical, convenient and affordable form of research.
 Measure competitive intelligence
Even though an omnibus survey remains a much-used and dependable research tool for non-profit organizations and government agencies who are interested in measuring competitive intelligence – there are some ways you could be getting even more out of the experience.
An omnibus survey is a great way to gauge public perception – especially on issues that are timely and may affect your organization’s decisions moving toward. Omnibus surveys are often employed to explore these perceptions, and the results can be used for advocacy or public education on many necessary information topics important to your brand.
Collaborate with research professionals on your questions
Chances are that if you’re ready to contact an agency about participating in a monthly omnibus, you already have a pretty good idea of the questions you want answers for.
But rather than submitting those questions directly, you could work with researchers to develop your questions in ways that could maximize your research budget.
Say you’re a development officer for a non-profit organization looking to gauge the sentiment of the general public about specific issues in the community or the province. You might ask participants to rank the important issues that surround your organization in a question-by-question format.
It could end up looking like:
Q1. Please rank the recognition from others you receive from donating, where 1 is the most important and 5 is the least important.
Q2. Please rank the tax credits you receive from donating, where 1 is the most important and 5 is the least important.
Q3. Please rank the personal gratification you receive from donating, where 1 is the most important and 5 is the least important.
You get the point.
Our researchers would have recommended developing the questions in a grid format – one in which multiple questions are asked in one question.
By taking multiple questions and reformatting them as a single question, that development officer could have found the savings on the questions they asked to be significant.
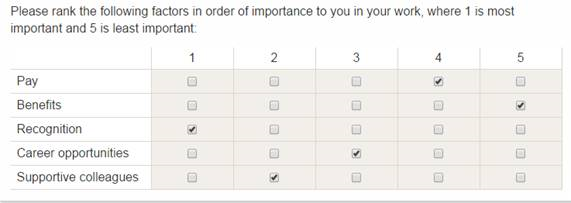
Take the question we ran in one of our own independent omnibus surveys:
This could have easily constituted multiple questions asked to our participants, with each answer option requiring ranking.
As you can see, our researchers instead chose to employ a grid format to save our participants from having to answer a battery of virtually identical questions.
And this speaks to another great reason to have researchers consult on developing your questions – making a better research experience for your participants. People appreciate when questions do not seem exhaustive or exploratory, so formatting questions in ways that take this into account makes for better and more rewarding research experiences.
And remember…
Get your questions in early enough to allow your research partner to explore the best options for your question types, and further, your reporting needs!
Adopt summary reporting to add significance to your detailed tables
 Market research can be like general home contracting – there are some jobs, like changing a faucet or painting a wall, that you can do yourself. But other times, there are jobs like fixing a foundation or re-plumbing your kitchen or bathroom that may require a bit more expert knowledge.
Let’s face it – sometimes it’s just better to call in an expert in the matter.
That’s why our OnTopic omnibus service offers the option to have our researchers develop a summary report based on your research questions.
Our researchers will take the detailed tables and subject them to advanced analysis and filter the data through their research lens to develop a summary report.
OnTopic summary reports can give an executive summary of the omnibus data you can use to describe the research findings to stakeholders, clients – or even your leadership team.
Our researchers can provide conclusions and recommendations – if they are applicable to the research – included in your summary report. This insights summary will allow you and your team to focus on what matters – the results.
The ability to ask a hot-topic question can really improve the ability to make agile business decisions – it allows your brand to gauge public perception, test brand awareness or gauge sentiment on issues that matter to your brand.
With just a few questions run through an omnibus, you’ll see how beneficial being prepared with apt insights can assist in decision-making.
Run a video survey question
Our survey platform provides our OnTopic clients the opportunity to employ video response options for their omnibus questions.
Video surveys are a powerful tool to evoke feedback and are an easy way to improve your omnibus research results.
Conveniently, there is no extra programming or time required to access the video response option for your omnibus questions. Our survey platform has the tool ready for you to use, built right in.
Video response questions can be exported as video highlight reels – capturing multiple respondents’ answers and allowing for an auto playback MP4 format.
These highlight reels give maximized omnibus results – our researchers are provided even more unique data to evaluate than an open-ended text response would be able to offer.

For the most part, open-ended text boxes in questionnaires have been one of the only approaches for these kinds of qualitative responses – and open-text boxes will always remain a valuable way to collect data, that’s true.
But there is something about video that helps bring participants’ thoughts and opinions into focus.
In case video responses feel intrusive to some, we still provide an opt out from those who wish not to engage this way. We re-state the same question using open-ended text boxes to not lose the data – that is why extra incentivization should be considered when asking respondents to share a video response.
Give context to the bigger story
The best way to get buy in using research results is when the data is packaged in a way that gives context to the bigger story. The benefit of omnibus research is the quick insights, not the level of data collected.
So, to do better data storytelling, having your research results reported as an infographic is an effective way to communicate to audiences who may not be well acquainted with the research problem or may not have a background in data interpretation.
A storytelling-through-visual-representation approach is comfortable and familiar. And since infographics are great for distilling insights collected from multiple sources, these visuals can be jam-packed with research insights that are easily digestible by all audiences.
Infographics are ready-made for social media sharing, presentations, conference boards – anywhere you want to maximize the reach of your research and communicate it to a broader audience.
For example, to share some insights from some of our syndicated research studies, we created social media-sized infographics that share data from the research report.
Infographics can help visualize your data while creating buzz around the research results.

Dive into those detailed tables
When you take part in the OnTopic omnibus, you will be provided with the detailed tables we generate based on the data your questions provoke. These tables contain all kinds of data, especially as it relates to gen pop demographic groups (like age and gender).
You can hold onto this data yourself and dive into it whenever you wish to investigate the data yourself and use it for business intelligence for marketing materials, presentations, grant development materials, business planning… the list goes on!
Detailed tables are part of our standard OnTopic offering – which means you can access and keep them at no extra cost.


